
EPL 25/26 PREDICTIONS

Yes this is hella late but I did make sure to post my predictions on instagram before the first game so I haven’t cheated. I’ve just been on holiday and adjusting back to UK life so the editing process has taken me ages. Hopefully you still enjoy my analysis whether it is right or proved to be very wrong about two months in to the season.
Third times the charm, or so I hope anyway. The last two seasons my points tally has been around 20 points which means I have got 1/3 correct. I believe I have improved in my analysis and last season was very close in terms of the tiers I had each team in, even if I was off with the positions within the tiers. I think the information I am adding this season as well as tweaks to what I have done in years past should set me up to have my best year yet.
Last season both myself and Dad got 18 points and Josh won it with 27. As a reminder it is three points for the correct place, two for one away and one for two away. I also changed last season to work off the XG table rather than the actual table and will be doing the same again as it helps to show under and over performers.
Once I have the XG table in order I am slightly changing the format to help both you and I be more informed. I will first review last season and summarise how they did in each competition and then use six stats to explain their play style from last season. The six I have chosen are
XG for and goals for- This shows how potent their attack was did they finish
XG against and goals against- This shows how miserly their defence was and goalkeeper performance as well as if opponents finished well against them
GK launch percentage- How often did they try to play out
PPDA- Passes per defensive action, used as a proxy of pressing intensity
Attacking speed- How quick did they go forward or were they a possession vs route one team
Direct attacks for - Some teams might be slow in possession but still like to counter which I think is an important distinction to make to pure possession teams
I did want to include giveaways in your own defensive third and direct attacks against as I think this would have shown essentially how good a team was at playing out and then counter-pressing. Unfortunately I could not find a list with all teams. For example Southampton were top of the list for defensive third giveaways but they had also the lowest launch percentage. I know they are not in the league anymore but it is interesting to me. Direct attacks against I also think is the first step to becoming a good defence as and I’m not sure if the stats back this up but I think they produce a higher XG so these should be avoided.
After I explain last season I will talk about changes made this summer where you will see the standard; manager change, squad change, change in European commitments and injury neutraliser numbers. For each of these four I assign a plus/minus value in terms of points gained or lost due to them. Manager change and squad change are obvious, having better for both will give you more points and vice versa. Change in European commitments comes down to the correlation between a settled 11 and points per game. Newcastle I find the most interesting team here as they have made the Champions League when they haven’t had midweek games and struggled two seasons ago when they did. This also impacts Spurs and United with that Europe league final somewhat of a poisoned chalice for two squads that need a lot of work to compete during two games a week.
This next part is a copy paste from last season so I’ll give a TLDR. 14.4 games missed through injury equals one point.
SKIP IF TLDR IS ENOUGH
Next is to adjust for injury luck and for the most important number is games missed. This does miss who got injured and which games they were missing for but it’s a good start to add it as one of my factors. KDB against Chelsea is a bigger miss than against Sheffield for example. The other thing is having one player out each game would be 38 games missed so pretty good number on this table but to have a 25 man squad out all at the same time would only be 25 but obviously much worse in that scenario.
So now I have to decide how much injuries matter as an average for each player in the squad. Assuming a squad size of 25 which is the registered players number even if people end up using more throughout the season I think three injuries per match week should be easily dealt with. 3x38=114 which is coincidentally the halfway point on our table. I arrived at this number as anecdotally it’s not the most important player injuries that have the most impact but having too many of the same positions injured at the same time. Most clubs can cover three defenders, midfielders or forwards. It might not then be an ideal lineup but it is still passable. Keeper injuries should be separate to this calculation but no one had a long term keeper injury last season anyway.
Now I have to decide how many games missed equals a point and then I’m good to go. The one outlier on this table is Chelsea which I put down to them having a massive squad which I think overcounts some players importance as they got injured but wouldn’t have played anyway. I am going to reduce their count by two games per match week to have it stand at 233. I think the easiest way is to take Newcastle with 258-114=144 and say these injuries cost them about 10 points. 144/10=14.4 games missed equals one point lost. This would mean the average player who was out for a whole season loses you 2.7 points. I’m happy with this number as it could explain a good amount but not all the points a team accrues each season.
RESUME POST TLDR
Then after I have talked about last season and the summer changes the third paragraph will be on the goals and predictions for the year. Their goals will mostly be based on last season and how much they have invested but the prediction will come down to the math ( back of the napkin style).
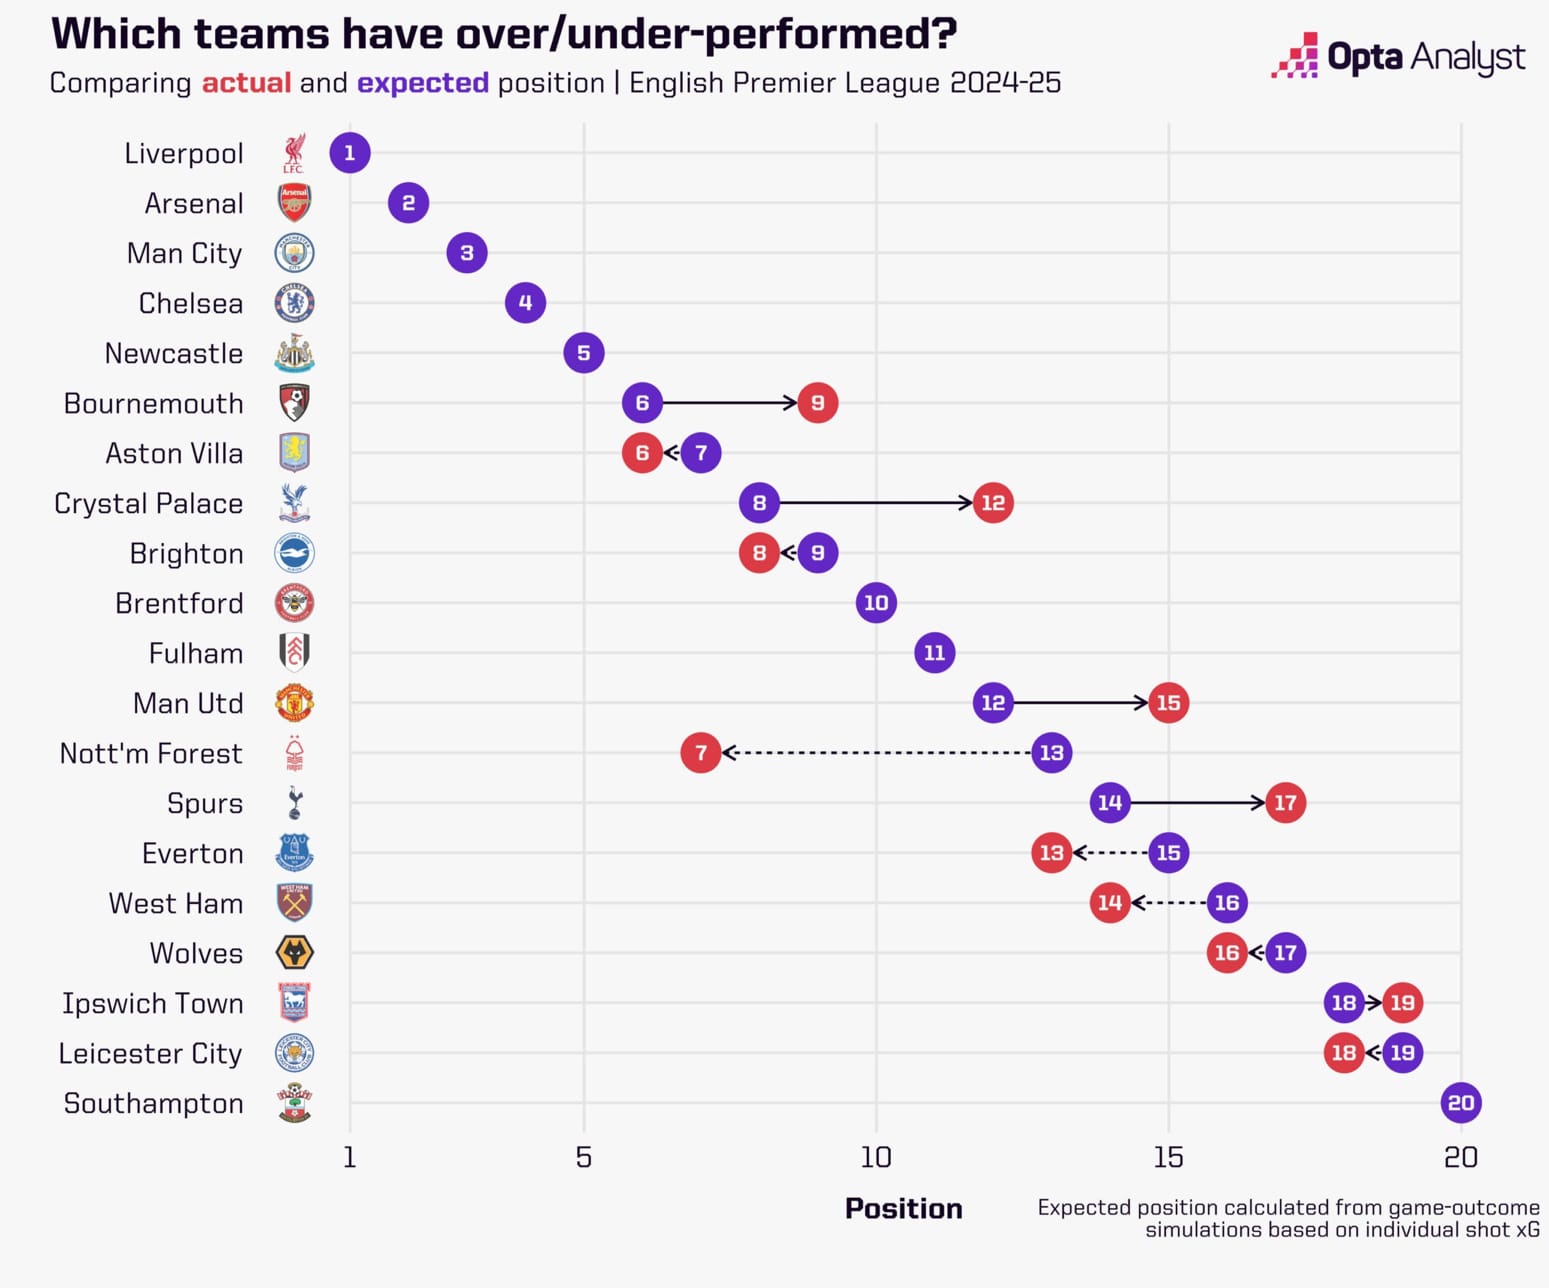
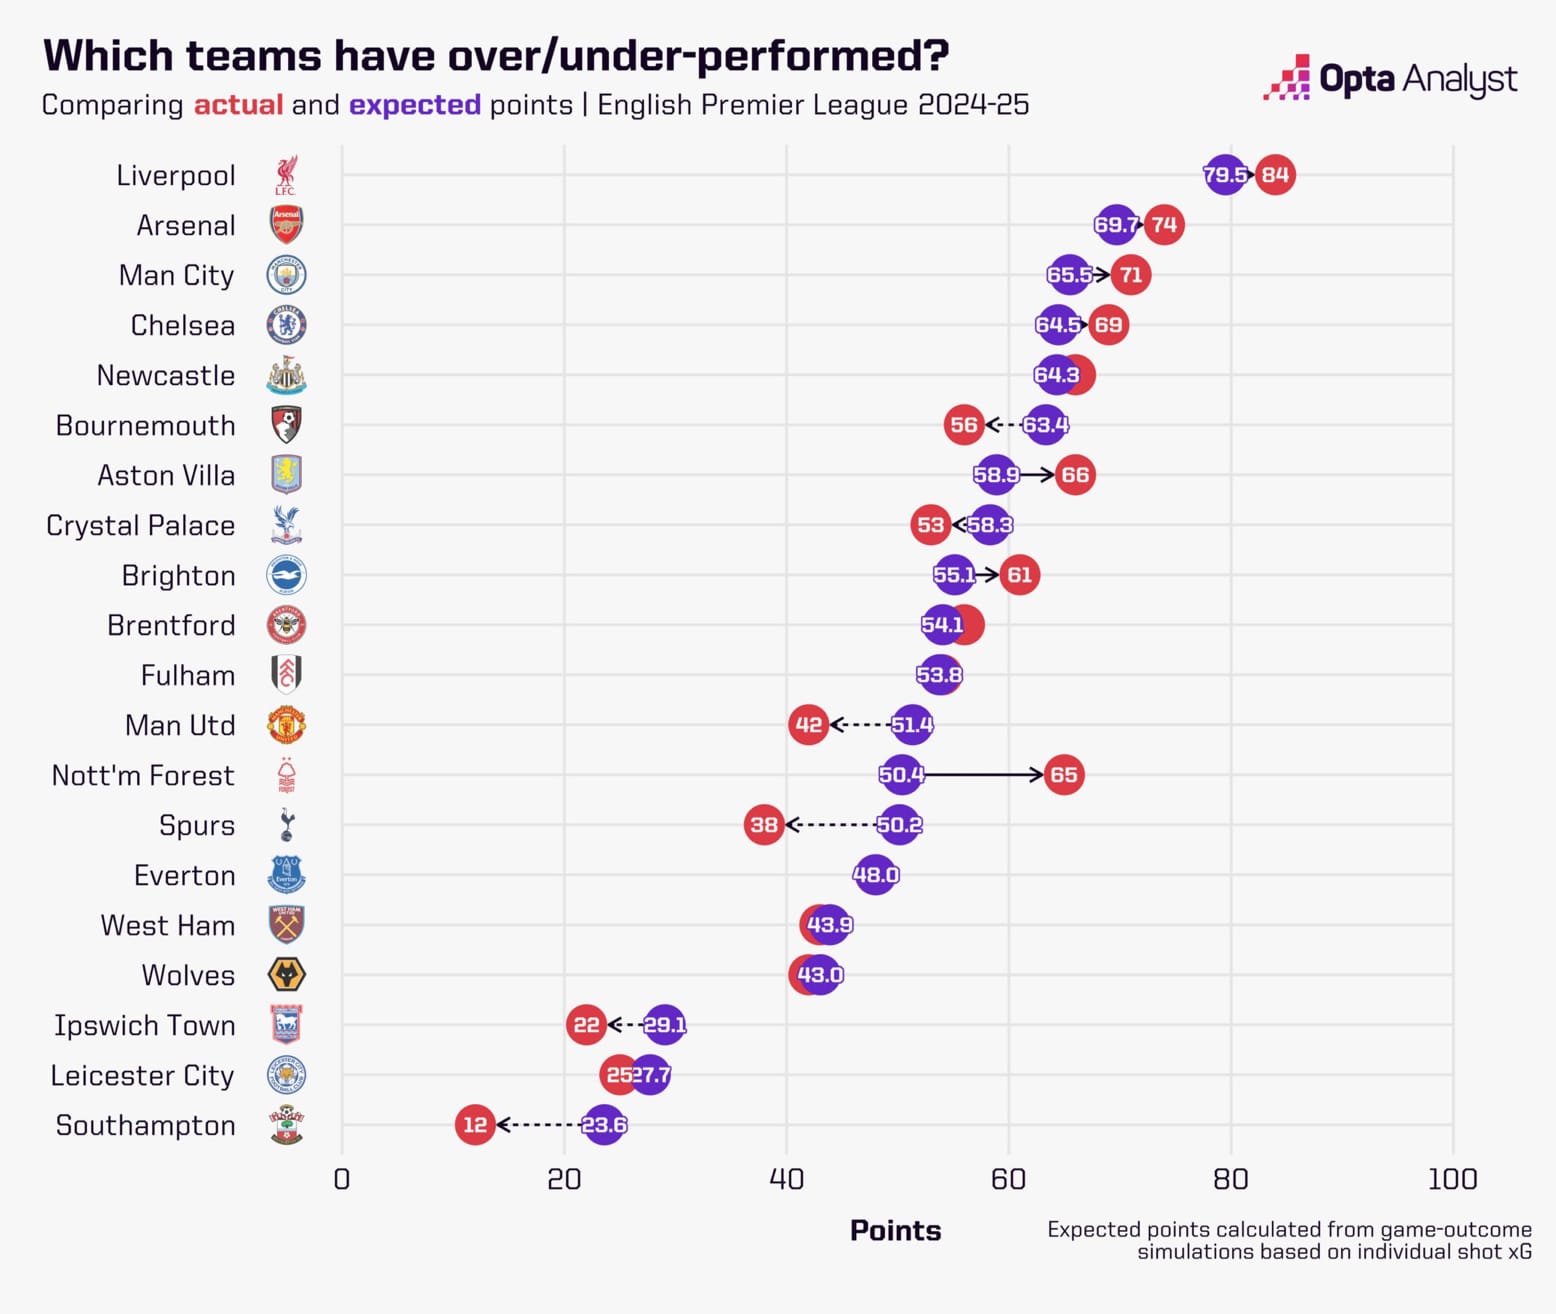
So these are the tables I am working from which I have appropriated from OPTA. I went to use the same site I used last year but their XG numbers were very different to FBRef, FotMob and OPTA. Each site will use a different calculation so small variances make sense but the other three are in the same ballpark where as the site I used last year is sometimes five goals different which is a big swing in terms of points.
First as we can see in the above graph most teams finished where they could be expected to or thereabouts. Bournemouth, Palace, Forest are the only three significant deviations. It’s interesting as although Bournemouth were good I'm not sure if they were the sixth best team for me and now with how raided they have been I'm not sure it matters anyway. Palace as well were a team of two halves as I pointed out in the end of season review article. No major losses yet means they don't need much if they can pick up where they left off which was a top 4 challenger in the second half of the season. Forest as well is one where XG usually devalues their playstyle. Counterattacking teams that soak up pressure and more shots even if of a lower quality tend not to rank as high. They, similar to Palace were a team of two halves going the other way and losing Elanga is big so the XG table could actually help me here bring their numbers back down to earth.

9/10 top half teams overperformed
8/10 bottom half teams underperformed
This somewhat shows the point I have made before that the table stretches each season. XG tables are based on every single time that shot has been taken which as the years go on the database it pulls from grows in to the thousands. Each Premier League season sees between 300 and 700 shots taken per team which while fairly big is still more susceptible to variation than the tens of thousands of shots XG uses.